Calibrate your monitor!
Please follow these instructions to get your monitor ready to
correctly display the sRGB images used in these pages. What these
instructions do is adjust your monitor to match the sRGB definition as
closely as possible.
What is this chart showing?
It was calculated in floating point and
converted to 8-bit file by using the sRGB and dithering algorithims
described in this paper.
The gray columns are a ramp from .005 to
5.005. The striped columns alternate 2 pixels of .01 and 2 pixels of
2*G-.01 (where G is the gray to the left). If your monitor is
displaying sRGB correctly these should average to G and the columns
should be the same luminance.
Unlike most such charts, I used 2 rows per stripe to reduce the
effect of blooming that most crt's have. You can reduce this even
more by zooming in on the image an integer number of times and
covering the screen with diffusion material to blur it.
I also did not use black in the dark stripes to reduce errors
caused by ambient light, except at the bottom where the stripe colors
are reversed. On my screen it is not possible to adjust the bottom area to
match.
The file was saved as a .gif rather then a .png due to some
browsers making attempts to gamma-correct .png files.
Return to main page
 control of the monitor
to maximum.
control of the monitor
to maximum.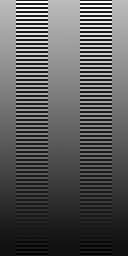
 control of the
monitor so that the vertical stripes are all the same intensity and
disappear as much as possible. If there seems to be a range in which
they match about the same, set the Brightness at the lowest end of the
range.
control of the
monitor so that the vertical stripes are all the same intensity and
disappear as much as possible. If there seems to be a range in which
they match about the same, set the Brightness at the lowest end of the
range.